MesoWest/SynopticLabs (MW/SL) recently added the new high frequency (5 minute) observations for many of the stations available in the NWS/FAA network. This data feed has been combined with the original hourly data feed to provide as many real-time observations for these stations as possible through the (MW/SL) products.
The amount and distribution of stations with a reporting frequency of 5 minutes or less is illustrated below:

However, the new 5-minute data feed does come with a few caveats. The temperature observations for the 5-minute data are only available in whole degrees Celsius (e.g., 29 degrees C), compared to the hourly observations which are usually available in tenths (e.g., 28.7 degrees C). This can cause some discrepancies when calculating high and low temperatures because the temperature values are rounded to whole degrees Celsius in the 5-minute observations and when converting temperatures from Celsius to Fahrenheit.
For example, 29.0 degrees C converted is 84.2 degrees Fahrenheit but 28.7 degrees Celsius converted is 83.66 degrees Fahrenheit.
To address these caveats, we’ve implemented two solutions. First, for those that utilize our Mesonet API, we’ve added an additional parameter to filter out the high-frequency METAR data for those who only want the official METAR hourly-observations. To turn off the high-frequency data, simply add the argument &hfmetar=0 to any API query (does not work with station/latest queries however). By default this value is set to 1 and all API queries will include the high-frequency METAR observations unless otherwise specified.
To see the difference this parameter makes on API queries, compare the examples below:
With HF METARS &hfmetars=1
Without HF METARS &hfmetars=0
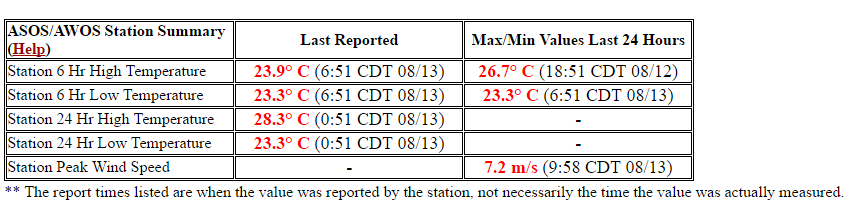
Second, on the Mesowest tabular display page, we’ve add in a new table to list the station high and low temperatures that come from the official METARS (see below) to differentiate from the standard high/low values that are computed from all observations.
Note: For more information on the high-frequency observations and how the maximum and minimum temperatures are being calculated, see the guide here.